

Chassis dynamometers are a great tool for measuring an engines power, both at the wheels and at the flywheel. They do this by measuring the torque against the engine speed and then calculate the hp using the following equation:
Hp = Torque X RPM / 5252
 This in principle all seems fine, but just how accurate is the data you are getting from the dyno? Well, the simple fact is this, not all dyno’s are the same and all dynos will produce different power figures on the same vehicle on the same day. A chassis dyno has to be able to calculate the losses from the wheels right back to the flywheel to get you a flywheel figure, so how does it do this? Well this is where the inaccuracies come and the ability for a dyno operator to be able to provide any chart he wants you to see.
Some of the factors which affect dyno readings are:
• Gear selected for the run. For a dyno to be as accurate as possible it needs a gear ratio of 1:1 or as close as the gearbox allows. This is usually 4th on manual gearboxes but always best to look up the ratios of the gearbox fitted to the vehicle. Using a lower gear than the one closest to 1:1 will reduce the power figures.
• The drum inertia settings. Most dynos have adjustable settings for drum inertia meaning you can change the weight of the roller settings. What does that matter you ask? Well the final power reading is relative to the drum inertia as the engine has to spin this mass to provide the acceleration. An assumed heavier roller will inflate the Hp readings, reducing the mass of the roller will lower the final Hp readings.
• Transmission losses. There are two types of losses you can apply to a wheel Hp dyno run to calculate the engine power, measured losses and % losses. A measured loss is basically a high speed run down where it calculates how long the vehicle takes to decelerate in Neutral from the red line, the faster it runs down, the higher the losses due to higher mass and vice versa. The other, % loss, is literally as it says, you apply a % loss to a chart of a made up pre-determined figure which has no real accuracy to it. If you want to show higher engine Hp figures, you simply increase the % losses and vice versa.
 We always tell our customers to get a vehicle checked on the same dyno both before and after the tuning has taken place, without a before run the modified run is literally pointless as there is no base for comparison. To demonstrate this point check out the following three charts which are all the same run on the dyno:
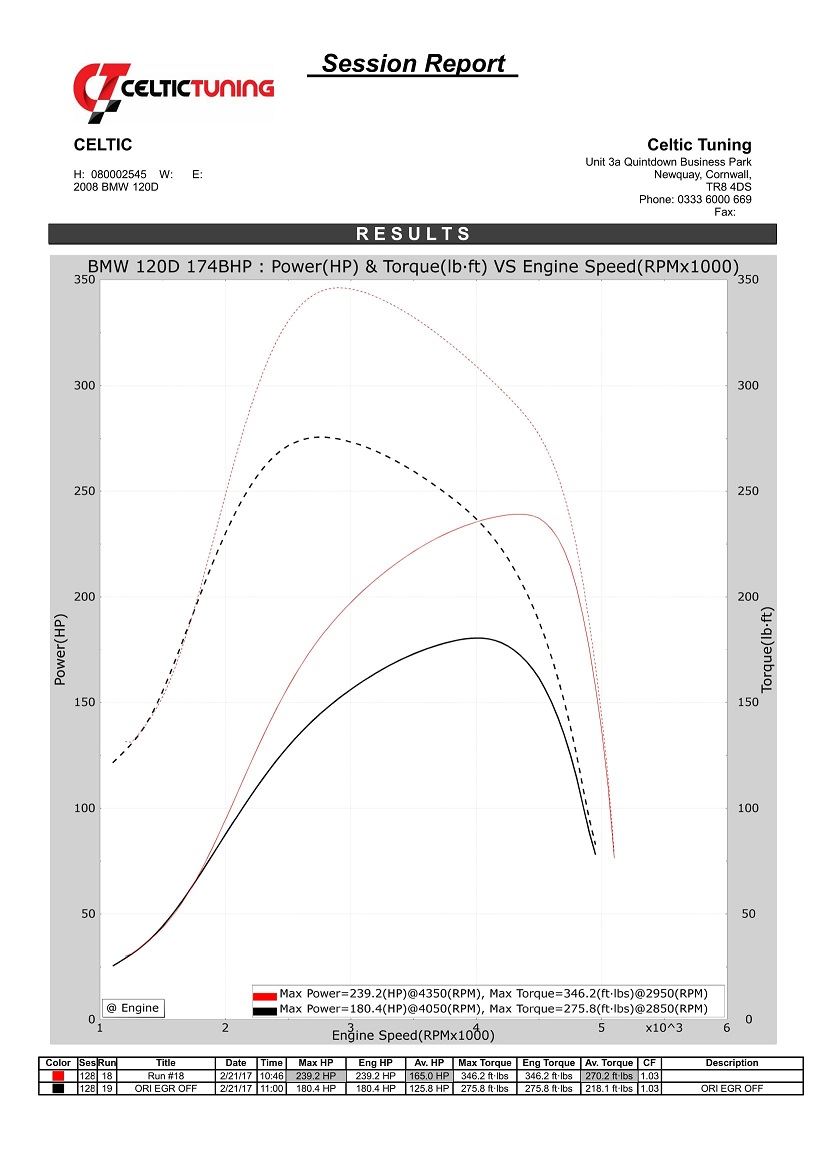 Chart 1 is a 120d 174bhp with both the before run and the modified run on the same chart. In this you can clearly see the gains as a means of comparison and the figures have some relevance as to what you are receiving from the tuning.
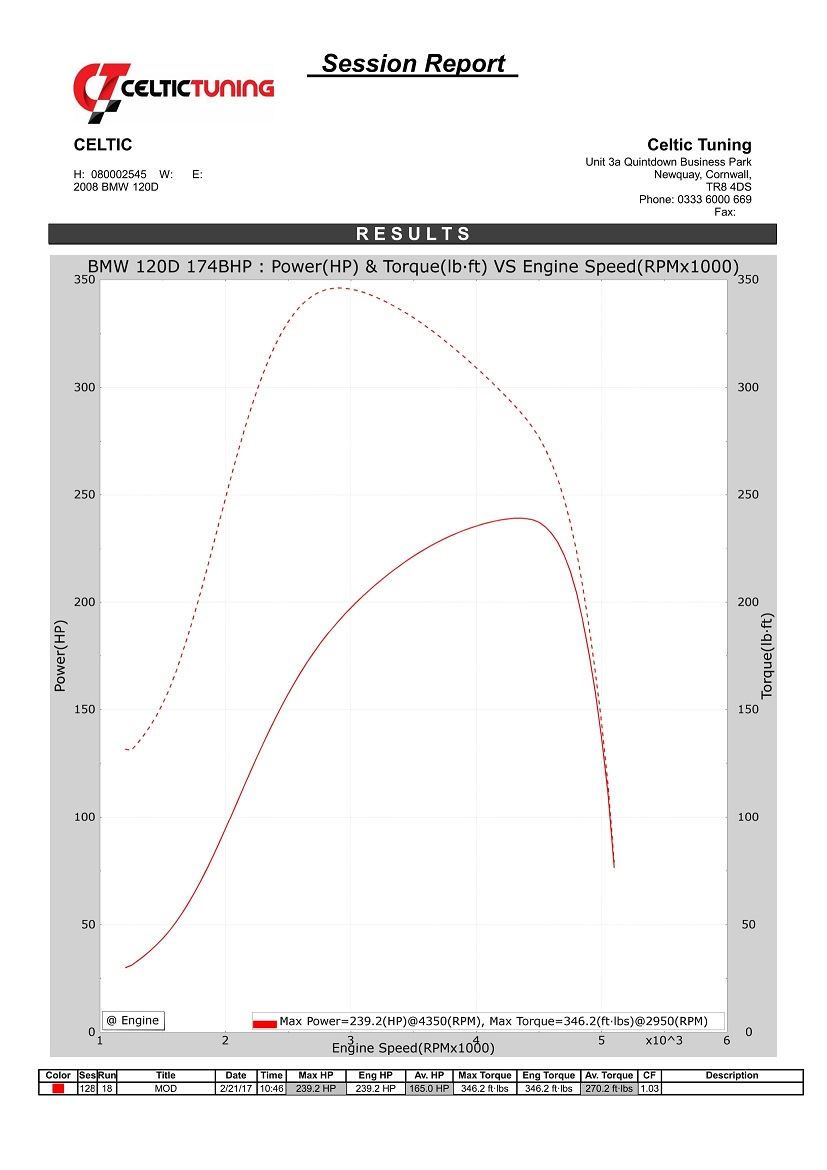 Chart 2 is the same chart of the same run but with just the modified run showing. You can see that without an Original run to it you are making the assumption that the car made stock figures.
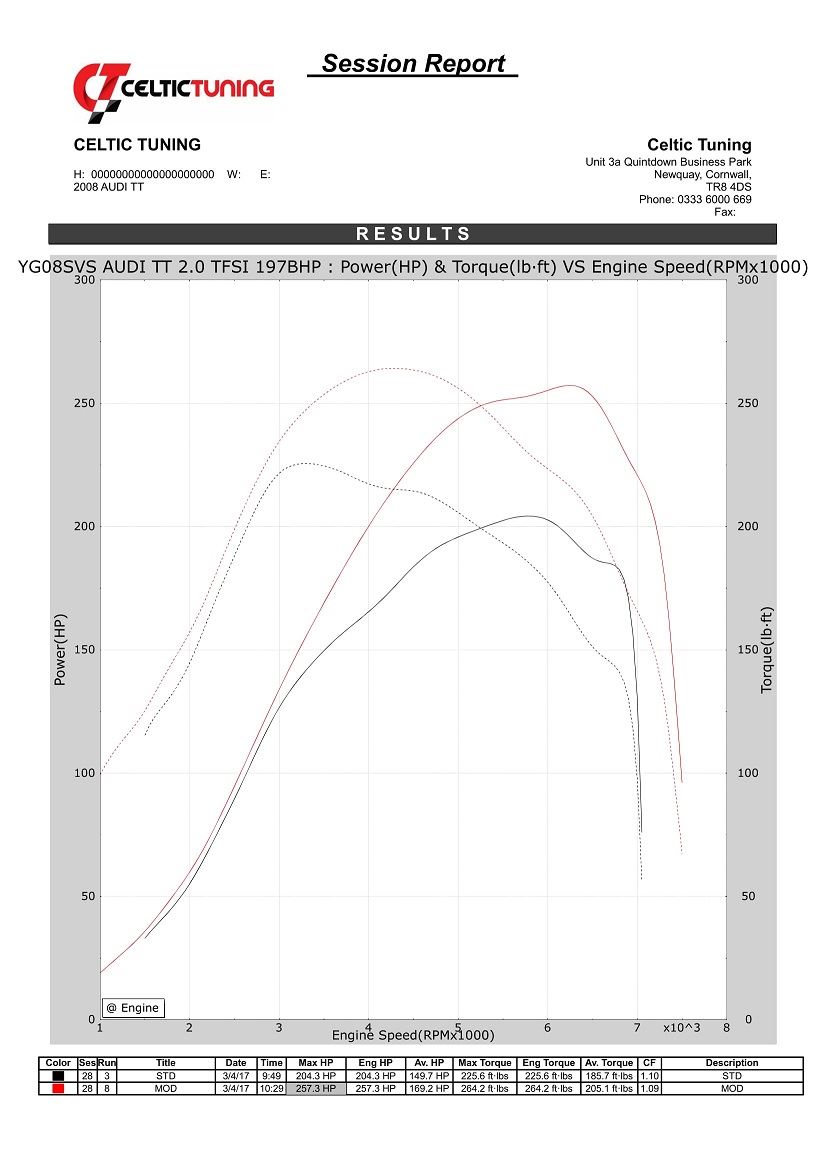 Chart 3 is EXACTLY the same run, the car has not been run again, we have simply adjusted the inertia settings of the dyno to exemplify the point that an operator can show you what he wants despite what the car may actually be making! Again, without the original run you have no means of comparison and assume it made stock power.
 Ok so you have had a before and after run on the dyno, can the figures still be manipulated to give deceptive figures? The answer is simply yes. A vehicle, especially turbo charged ones, never put out consistent figures on a dyno due to the large variations in intake and exhaust gas temperatures along with associated engine heat soak. When providing a customer with a graph for your tuning, naturally you will provide the one with the best power chart. To illustrate this point attached a two more charts:
 Chart 4 is of an Audi TT 2.0 TFSi 197bhp with Bosch MED9.1 management system. You can see it made around stock figures producing 204bhp and a modified peak of 243bhp.
 Chart 5 is the same Audi TT on the same day, this run being directly after the one in Chart 4. This time the vehicle makes 257bhp but slightly less torque illustrating the variation turbo charged vehicles can have.
The point of this is to demonstrate that chassis dynos are just a comparison tool, for extremely accurate engine Hp figures an engine dyno is required which requires the engine to be removed from the vehicle and therefore not practical. The issue with the tuning industry is the perception that ‘Dynos’ are accurate and every tuner has the ‘best’ dyno…. neither of which are true. There are many dyno operators out there who buy and sell software, adjusting figures to be lower than they are is simply a sales tactic employed by many to persuade the owner to buy their software instead. If you want a genuine power reading from your vehicle then, whoever you choose for your tuning, it is always recommended to use their dyno as they will always want to provide you with the best results.